How to install and run prometheus/node_exporter on raspberry pi
In the current time is prometheus THE monitoring and alerting tool. I describe here how you can setup the node_exporter on a Raspbian based Solution.
Introduction
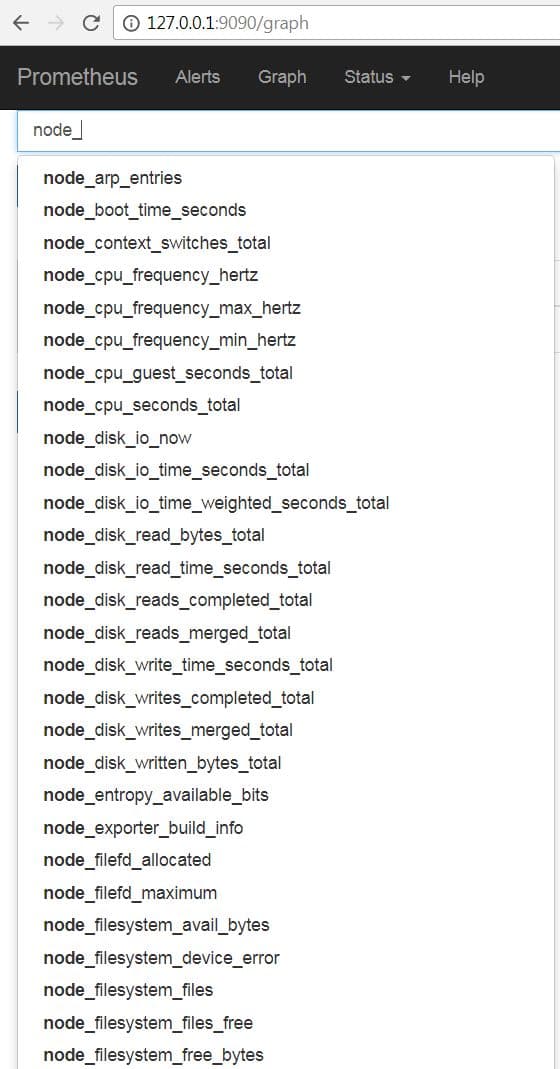
The node_exporter is a good start tool to get some metrics from the pi.
Here is a example what you can scrape at node_level
Prerequisites
- A runnig PI
- Internet connectivity
- root permissions
Setup
The following steps assume that you have fulfilled the Prerequisites and you are logged in as root on your pi
Dowlnoad
cd /home/pi
curl -sSLO https://github.com/prometheus/node_exporter/releases/download/v0.16.0-rc.0/node_exporter-0.16.0-rc.0.linux-armv7.tar.gz
tar xfvz node_exporter-0.16.0-rc.0.linux-armv7.tar.gz
Install systemd files
cd /etc/systemd/system/
curl -sSLo - https://raw.githubusercontent.com/prometheus/node_exporter/master/examples/systemd/node_exporter.service \
  |sed -e 's|/etc/sysconfig/node_exporter|/etc/default/node_exporter|' |sed -e 's/^User.*//'  > node_exporter.service
curl -sSLo - https://raw.githubusercontent.com/prometheus/node_exporter/master/examples/systemd/sysconfig.node_exporter \
  |sed -e 's/^OPTIONS/#OPTIONS/;aOPTIONS=""' >/etc/default/node_exporter
cp /home/pi/node_exporter-0.16.0-rc.0.linux-armv7/node_exporter /usr/sbin/node_exporter
systemctl daemon-reload
systemctl enable node_exporter.service
systemctl start node_exporter.service
Files
/etc/systemd/system/node_exporter.service
[Unit]
Description=Node Exporter

[Service]

EnvironmentFile=/etc/default/node_exporter
ExecStart=/usr/sbin/node_exporter $OPTIONS

[Install]
WantedBy=multi-user.target
/etc/default/node_exporter
#OPTIONS="--collector.textfile.directory /var/lib/node_exporter/textfile_collector"
OPTIONS=""
Query
After all this steps you should be able to query the node_exporter
curl 127.0.0.1:9100/metrics
The next step is to run prometheus and grafana ;-)